Wiki Education’s Impact Visualizer tool is ready to go! I’ve set it up for the global Wikimedia community at impact-visualizer.wmcloud.org, where you can sign in with your Wikimedia account and use it to generate visualizations of how a set of articles has evolved over time.
One of the biggest communication challenges at Wiki Education is how to convey the scale of the impact that our programs have. We can point to an individual article that a group of students worked on, and we can show off aggregate statistics like the number of words added and the number of articles created. But our programs are designed to empower scholars to leverage their own areas of expertise to improve Wikipedia; when an instructor in our Wikipedia Student Program incorporates a Wikipedia writing assignment term after term, they’re impacting Wikipedia’s quality and comprehensiveness not just for a single article but an entire topic area.
For example, Professor Glenn Dolphin has been using a Wikipedia assignment in his introductory geology classes since 2016. Each time, his students work on one of Wikipedia’s long-standing gaps in representation by creating or expanding articles about women geologists. The before/after view of one of these articles gives a concrete sense of the work Professor Dolphin and his students are doing, but how do you show the bigger picture?
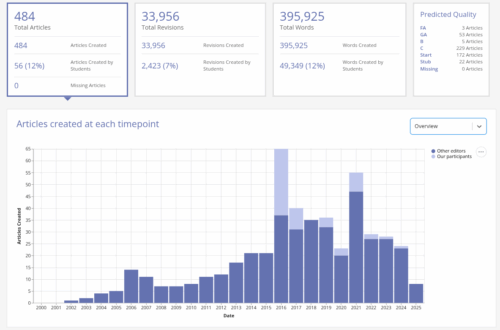
That’s where the Impact Visualizer comes in. For this example, we’ve created a Topic that includes all of the biographies of women geologists that exist on English Wikipedia (based on a Wikidata query), and added a list of all the usernames of Professor Dolphin’s students over the years. The Impact Visualizer shows how focused activity in a neglected topic area can drive further improvements, including additional contributions by other Wikipedians.
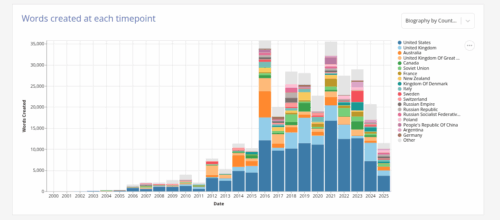
One of the newer features of the Impact Visualizer is called ‘Classifications’, and it lets us use Wikidata to analyze the articles within an Impact Visualizer topic in more detail. For example, we’ve applied a Biography classifier, which shows not only which articles within the topic are biographies (i.e., instances of “human” on Wikidata), but also breaks them down by gender (nearly all female, according to the Wikidata items) and by nationality.
If you have a topic — that is, any set of articles you care about — that you want to analyze with the Impact Visualizer, it’s ready to try! I’ve added a documentation page on Meta that walks through the steps of setting up a new topic and generating the data. Give it a try, and let me know if you run into trouble or have any feedback about the tool!